Using Results
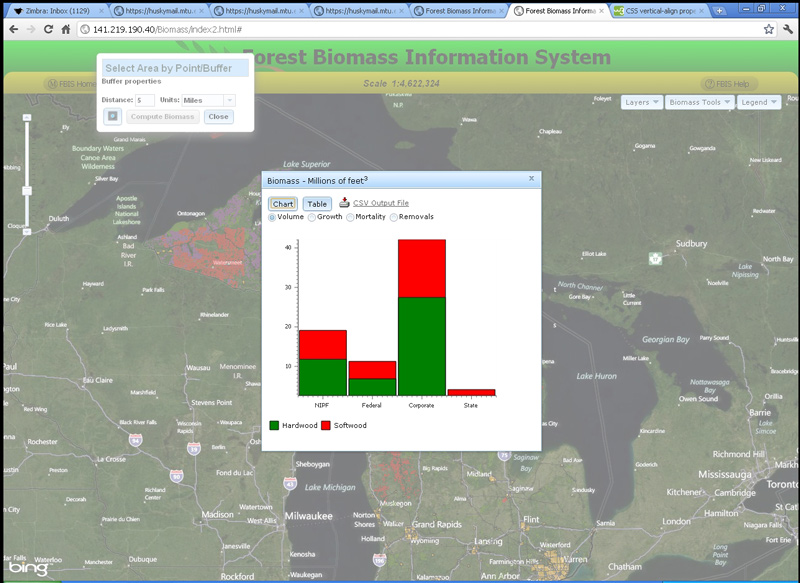
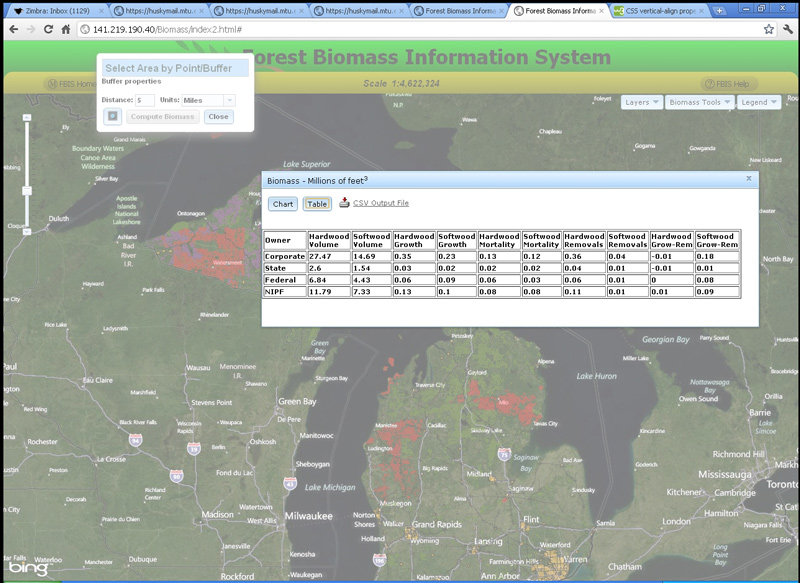
The Results window displays output from the Biomass tools.
- A chart of biomass volume is initially displayed.
- Use the radio buttons to change the chart display to growth, mortality or removals.
- Click the table button to see a tabular view of the data.
- Click the download icon to download a .csv file that can be read by Microsoft Excel. Note: the download data is in raw cubic feet whereas the charts and table diplay millions of cubic feet.
- To print the map along with the associated polygon, buffer and chart display, utilize your web browser's print functions.

